


Dragon Ball vs One Piece
When deploying capital into anime collectibles, where does your money hold value better? Beneath the fandom rivalry lies a stark structural difference in manufacturer economics. Dragon Ball's Premium Tier relies heavily on limited-window, direct-to-consumer web exclusives (such as Tamashii Web Shop S.H.Figuarts) with few historical restocks, while One Piece's Premium Tier anchors on retail-distributed mass lines (MegaHouse Portrait of Pirates and Banpresto Grandista), yielding broader supply circulation and predictable retail windows. Scorecard verdict: Dragon Ball leads the 7-metric scorecard 5–2. Dragon Ball posts the stronger Market Health Index, while Dragon Ball holds the single highest individual valuation at the grail level.
Head to Head
7 metrics — same as /aggregate Universe Comparison. One winner per row; ties credit neither side.
Dragon Ball offers the broader selection of distinct SKUs (2,347 vs 1,381 tracked targets), while One Piece carries 1.1× the estimated capital value per SKU.
Mid-market floor: median secondary prices run $75 for Dragon Ball vs $74 for One Piece. Market Health Index: 75/100 for One Piece vs 87.5/100 for Dragon Ball.
Liquidity (share of catalog with price data): 53% for One Piece vs 64% for Dragon Ball — Dragon Ball shows the higher trading frequency.
Top Grails
The 5 most valuable figures in each universe. The grail curve shows price distribution on a shared scale — a steep drop signals a thin market, a gradual curve signals grail depth.


The slope of a universe's grail curve indicates market depth: a steep cliff signals a thin, top-heavy market, whereas a gradual decline indicates deep collector willingness to spend across multiple tiers.
Dragon Ball controls the absolute top-of-book ceiling: Dragon Ball's #1 is Dragon Ball Super - Golden Frieza - Mega Premium Masterline (MPMDBS-04) - 1/4 (MegaHouse, Prime 1 Studio) at $1.4K; One Piece's #1 is One Piece - Monkey D. Luffy - Mega Premium Masterline (Prime 1 Studio) at $1.4K.
One Piece spans 40 distinct product lines (vs 36 for Dragon Ball), diversifying risk so that a stumble by a single brand has less systemic impact.
Market Movers
Rising and cooling figures in each universe over the last 90 days. A cooling top grail is often the best sniper setup.
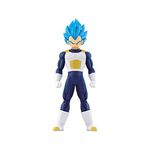
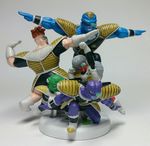
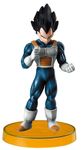
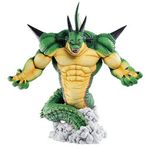
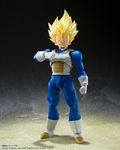
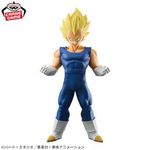
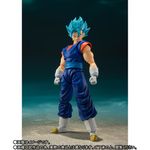






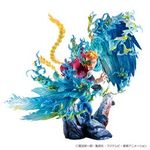
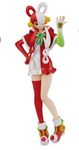

Rising figures signal active collector demand — often a franchise catalyst (new season, restock scare, collab announcement) or a key piece changing hands at auction and resetting the anchor price. Cooling entries in validated grails are typically the best sniper setup: if scarcity fundamentals haven't changed, a temporary dip tends to recover within 60–90 days.
Product Lines
Top figure lines by catalog size and avg secondary market price.
The Verdict
Three angles, each resolved from the live numbers above — a tie is called a tie.
Dragon Ball's higher median ($75 vs $74) absorbs market pullbacks with less downside volatility. Structurally, One Piece's Premium Tier is anchored by retail-distributed mass lines (MegaHouse Portrait of Pirates and Banpresto Grandista) with broader supply circulation, while Dragon Ball's leans on limited-window web exclusives.
One Piece: 75% advancing (3 gainers vs 1 losers), 53% liquidity.
Momentum (share of 90-day movers advancing): 88% for Dragon Ball vs 75% for One Piece.
Dragon Ball: strongest gainer is Super Dragon Ball Heroes - Vegeta SSGSS Evolved - Super Dragon Ball Heroes Skills Figure 05 (+500%+, now $457); sharpest cooling is Dragon Ball Z - Vegeta SSJ - S.H.Figuarts - Awakened Super Saiyan Blood (−71.2%, now $7).
One Piece: strongest gainer is One Piece - Nico Robin - One Piece Figure Collection 1 (+500%+, now $141); sharpest cooling is One Piece - Trafalgar Law - Excellent Model - Portrait of Pirates SOC - 1/8 - Ver.R (MegaHouse) (−67.6%, now $39).
Full lists are in the Market Movers section. Sniper note: a sharp dip on an established line with intact scarcity fundamentals is a watch signal, not a verdict — check condition and sample size before treating it as a trend.
Dragon Ball commands the higher absolute trophy valuation (Dragon Ball's #1 at $1.4K vs One Piece's at $1.4K).
For grail-tier liquidity, Dragon Ball leads on aggregate: its larger estimated market cap offers deeper transaction history to anchor bids and comps. Dragon Ball: 88% advancing (7 gainers vs 1 losers), 64% liquidity.
Bottom line: while Dragon Ball leads the aggregate scoreboard 5–2, capital allocation should align with your investment thesis. Choose Dragon Ball for liquidity, higher price floors, and high-ceiling trophy hunting at the top end of the market. Choose One Piece for lower concentration risk.
Track every grail. Catch every deal.
Real transaction data. Real sniper opportunities. Free to start.