


Dragon Ball vs Saint Seiya
Head-to-head secondary market valuation analysis based on 3,329 tracked SKUs and continuous transaction records. While both flagship franchises originate from Bandai's production ecosystem, their secondary market mechanics diverge fundamentally. Saint Seiya's secondary economy is driven largely by the Myth Cloth EX line — Tamashii Web Shop exclusives sold in limited-time order windows with little restock history, which caps secondary supply once the pre-order closes. Dragon Ball's secondary economy covers the same premium tiers (Prime 1, Tsume, S.H.Figuarts exclusives) but stretches down into large volumes of prize figures (Ichiban Kuji, WCF, Grandista) and retail releases, creating a 2.4× wider catalog that dilutes average pricing. Scorecard verdict: Dragon Ball leads the 7-metric scorecard 4–3. Saint Seiya carries the higher average sold price; Saint Seiya posts the stronger Market Health Index.
Head to Head
7 metrics — same as /aggregate Universe Comparison. One winner per row; ties credit neither side.
Dragon Ball offers the broader selection of distinct SKUs (2,347 vs 982 tracked targets). Saint Seiya commands the higher average sold price ($299 vs $116).
Market Health Index: 88.9/100 for Saint Seiya vs 87.5/100 for Dragon Ball. Momentum: 89% of movers advancing for Saint Seiya vs 88% for Dragon Ball.
Entry floor: median secondary prices sit at $75 for Dragon Ball vs $193 for Saint Seiya. Liquidity (share of catalog with price data): 64% vs 41% — Dragon Ball shows the higher transactional velocity and cleaner exit signals.
Top Grails
The 5 most valuable figures in each universe. The grail curve shows price distribution on a shared scale — a steep drop signals a thin market, a gradual curve signals grail depth.


The grail curves above show how each universe distributes value across its top tier — a steep drop signals a thin, top-heavy market; a gradual curve signals depth.
Dragon Ball holds the higher extreme ceiling: Dragon Ball's #1 is Dragon Ball Super - Golden Frieza - Mega Premium Masterline (MPMDBS-04) - 1/4 (MegaHouse, Prime 1 Studio) at $1.4K; Saint Seiya's #1 is Saint Seiya - Virgo Shaka - Gold Myth Cloth 1/4 Deluxe (Soul Wing Studio) at $1.3K.
Market Movers
Rising and cooling figures in each universe over the last 90 days. A cooling top grail is often the best sniper setup.
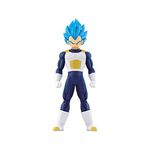


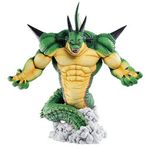
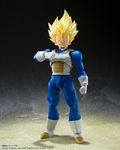
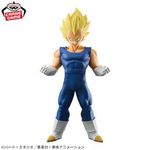
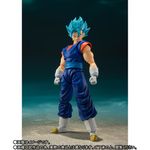


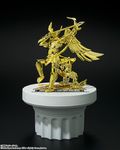
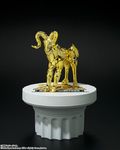



Rising figures signal active collector demand — often a franchise catalyst (new season, restock scare, collab announcement) or a key piece changing hands at auction and resetting the anchor price. Cooling entries in validated grails are typically the best sniper setup: if scarcity fundamentals haven't changed, a temporary dip tends to recover within 60–90 days.
Product Lines
Top figure lines by catalog size and avg secondary market price.
The Verdict
Three angles, each resolved from the live numbers above — a tie is called a tie.
Saint Seiya holds the higher median ($193 vs $75), with 89% of Saint Seiya's tracked movers advancing vs 88% for Dragon Ball.
The structural driver on the Saint Seiya side: Myth Cloth EX web-exclusives are sold in a single limited-time purchase window with little documented restock history — once the window closes, the only source is the secondary market. Dragon Ball has seen anniversary re-releases and revival lines that reset expectations for parts of its Prime 1 / S.H.Figuarts tier.
Liquidity (share of catalog with live price data): 64% for Dragon Ball vs 41% for Saint Seiya; Saint Seiya leads on momentum.
Dragon Ball: strongest gainer is Super Dragon Ball Heroes - Vegeta SSGSS Evolved - Super Dragon Ball Heroes Skills Figure 05 (+500%+, now $457); sharpest cooling is Dragon Ball Z - Vegeta SSJ - S.H.Figuarts - Awakened Super Saiyan Blood (−71.2%, now $7).
Saint Seiya: strongest gainer is Saint Seiya - Virgo Shaka - 1/6 (Immortals Collectibles) (+500%+, now $330); sharpest cooling is Saint Seiya - Sagittarius Aiolos - HQS - 1/6 (Tsume) (−59.9%, now $161).
Full lists are in the Market Movers section.
Dragon Ball's $75 median floor is the lower entry point, vs $193 for Saint Seiya. Dragon Ball: 88% advancing (7 gainers vs 1 losers), 64% liquidity.
Dragon Ball's top series holds 14% of its catalog; Saint Seiya's holds 23%. Dragon Ball is the more diversified book if any single line cools; Saint Seiya is the more concentrated bet, with higher signal-to-noise on line-specific catalysts.
Bottom line: Saint Seiya's web-exclusive supply model and Dragon Ball's broad prize-to-premium range produce two different economies from the same factory. On the current numbers, Saint Seiya offers a higher price floor and stronger market health. Dragon Ball offers trade liquidity, an accessible entry point, and the higher trophy ceiling.
Track every grail. Catch every deal.
Real transaction data. Real sniper opportunities. Free to start.